Charts
- Before a chart can be created using matplotlib.pyplot and numpy.
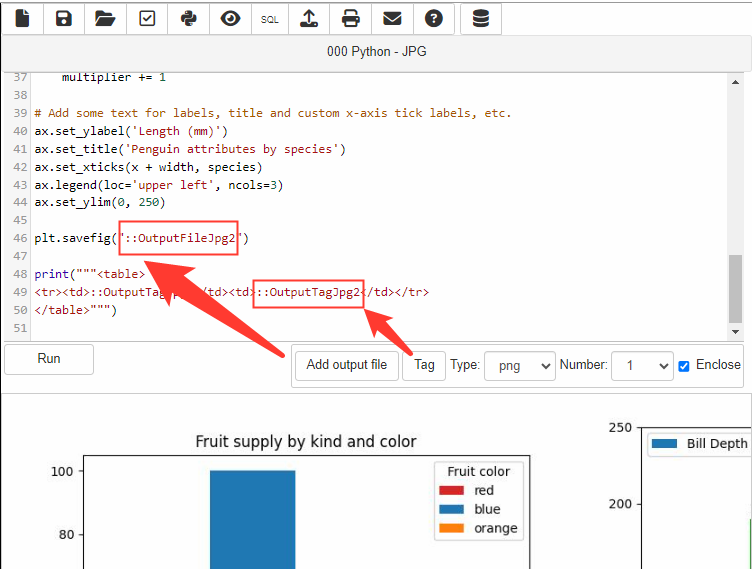
Click "Add output file" to insert it in the Python code like: "plt.savefig("::OutputFilePng1")"
- Placeholder ::OutputFilePng1 will be replaced with a temporary file path
- If you uncheck the "Enclose" checkbox only the placeholder will be pasted into the Python code
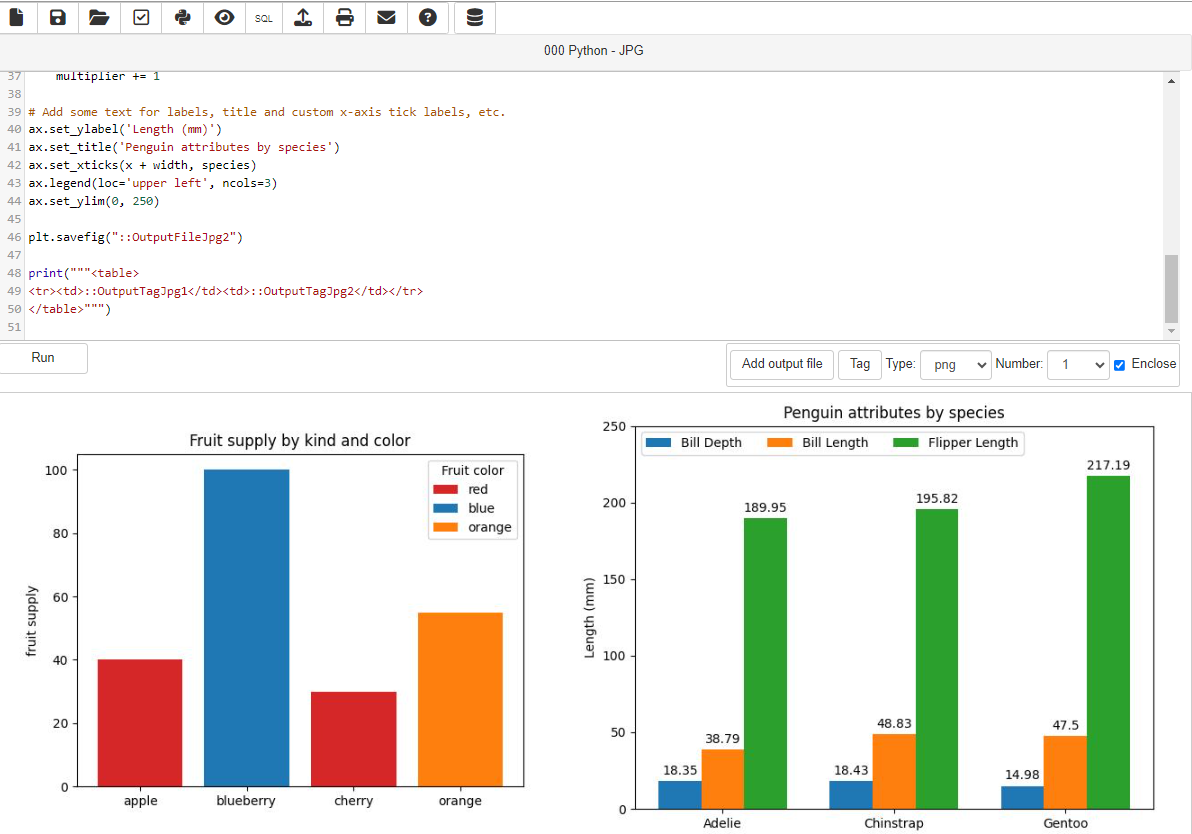
- The charts will be displayed on top before the text generated by the Python code
- To arrange charts using HTML, open options and for "Output type" select "HTML and Output files".
Click "Tag" button to insert the chart image tag into your HTML code like:
"<table border=1 width=100 cellspacing=0 cellpadding=5>"
"<tr><td>::OutputTagPng1</td><td>::OutputTagPng2</td></tr>"
"<tr><td>::OutputTagPng3</td><td>::OutputTagPng4</td></tr>"
"</table>"